Teams were moving between multiple tools to understand the real risk position.
Concept work. This case study illustrates PSCS’ approach using a representative concept brand. It does not depict a named client or verified results.
CASE STUDY / CYBER SECURITY
DUMMY CONTENT / DESIGN PREVIEWSecurity signals,
made visible.
A cyber-risk command platform that turns complex security information into clear priorities, actions and operating visibility.
Explore the case study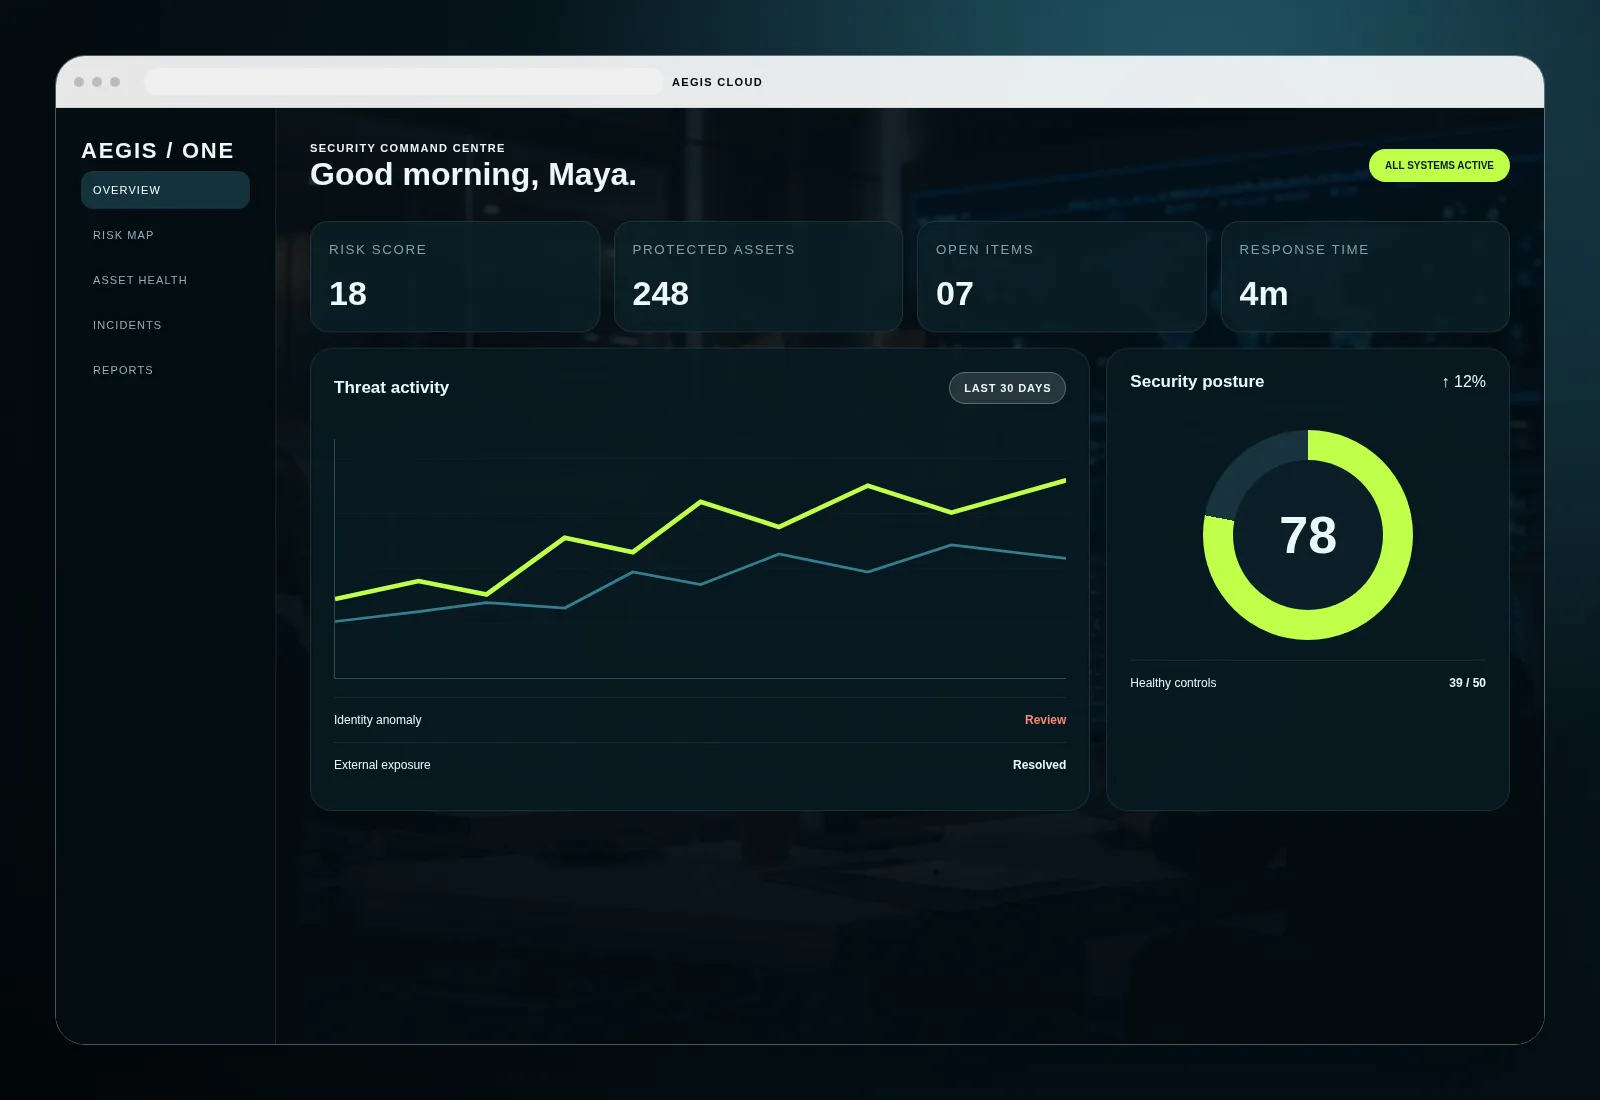
CLIENTAegis / One
Dummy Brand
Dummy Brand
INDUSTRYCybersecurity &
Enterprise Risk
Enterprise Risk
DELIVEREDSecurity Platform
Dashboard UX
Dashboard UX
PLATFORMSWeb Dashboard
Cloud
Cloud
PROJECT TYPEProduct Design &
Engineering
Engineering
THE BUSINESS PROBLEM
The organisation had security data, but not a clear operating picture.
Threat information was spread across tools, reports and teams. Leaders could see activity, but they could not quickly identify what required attention first.
The business needed one controlled security view for assets, vulnerabilities, incidents and response priorities.
KEY CHALLENGES
What needed to change.
The project focused on clarity, risk prioritisation, response speed and executive visibility.
The interface needed to distinguish business-critical exposure from routine activity.
Open items, ownership and response status needed one operating workflow.
Technical information needed to become clear business-level risk reporting.
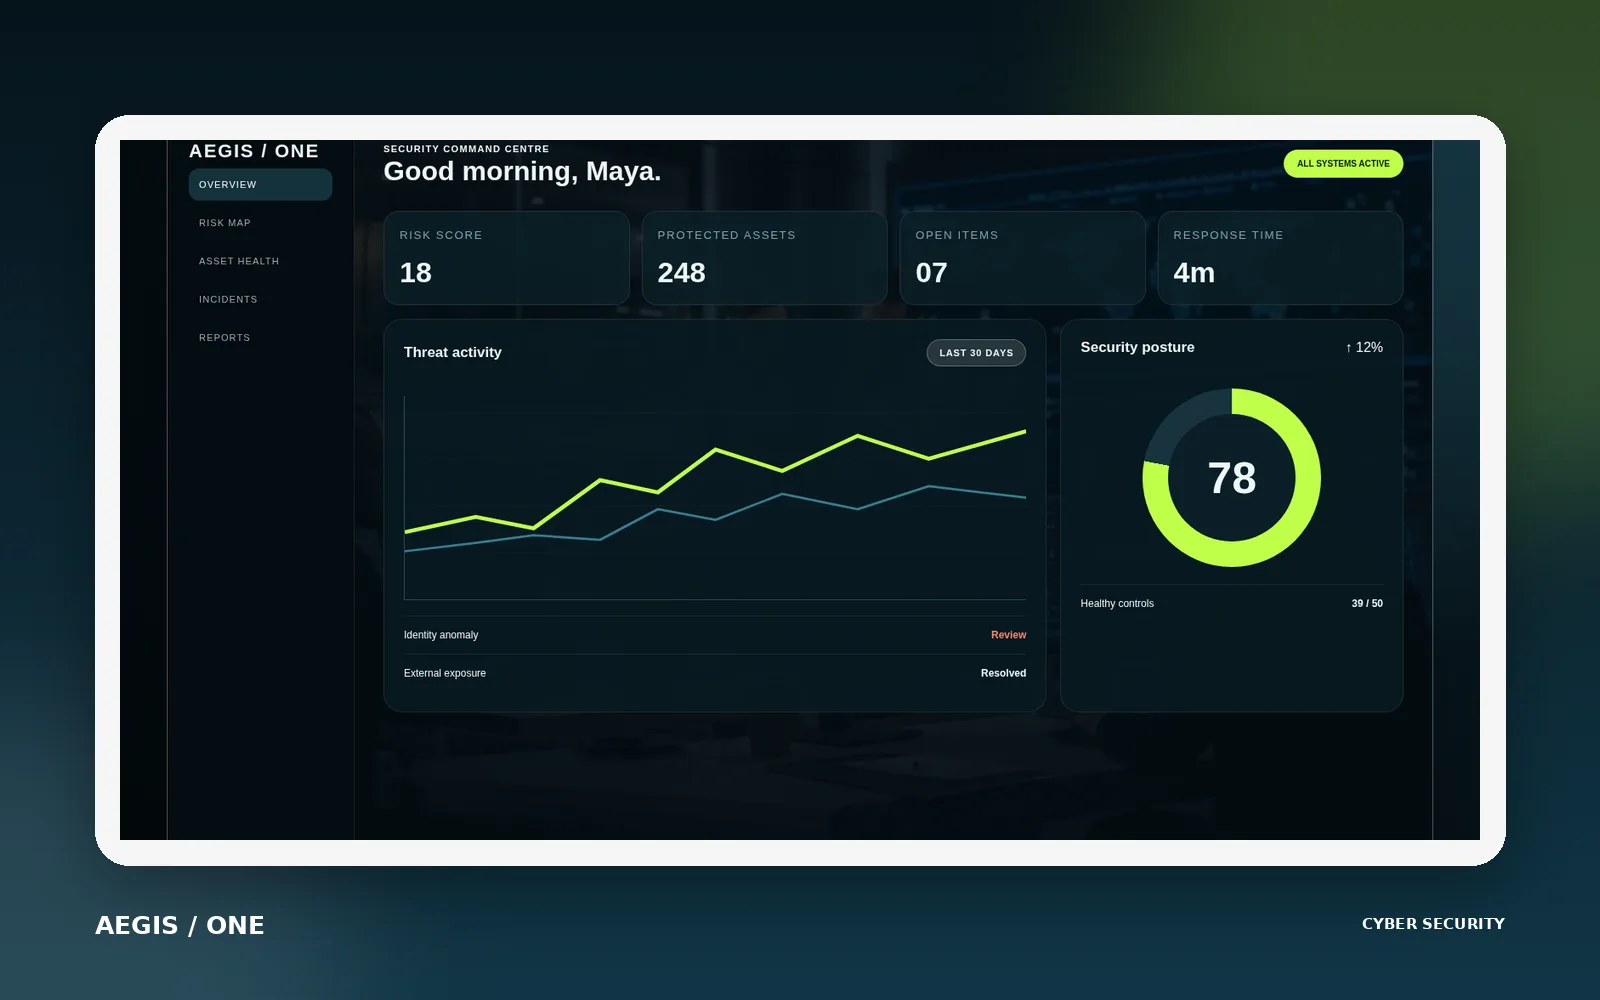
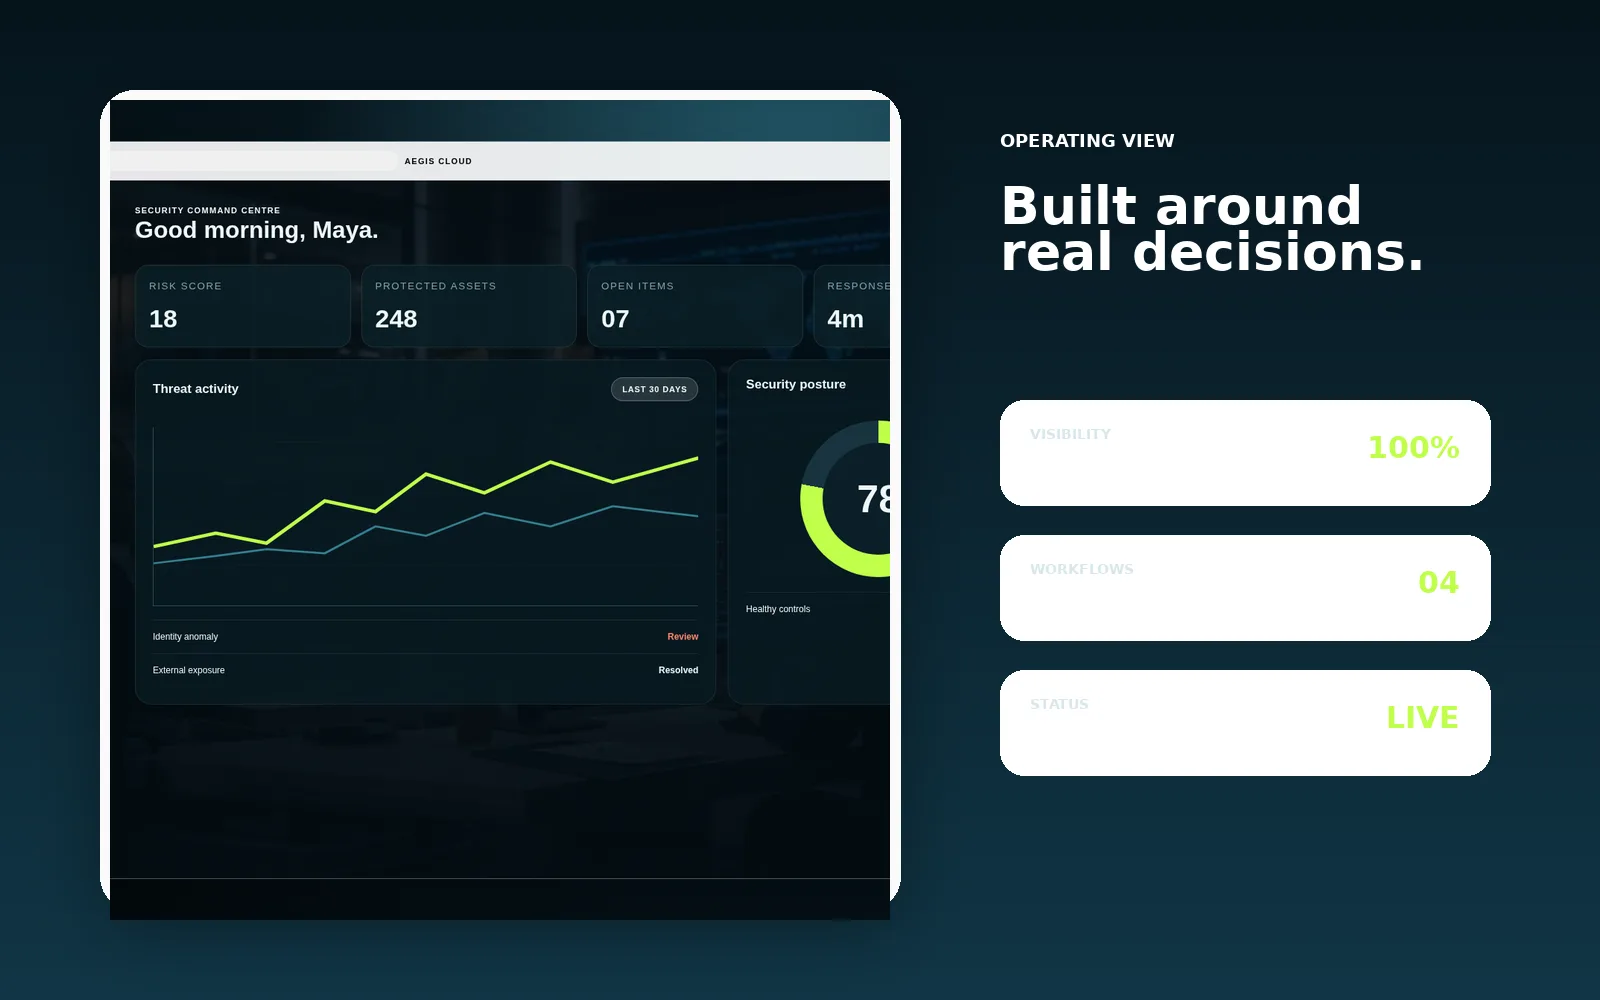
Threat activity, protected assets, open actions and posture indicators were combined into one practical decision surface.
THE SOLUTION
One controlled risk platform.
PSCS designed the platform around the decisions security teams and business leaders need to make every day.
01Risk overview
One prioritised view of exposure, incidents and control health.
02Asset monitoring
Clear status across applications, infrastructure and critical systems.
03Response workflow
Ownership, review, escalation and resolution visible in one place.
04Executive reporting
Business-readable summaries without losing technical depth.
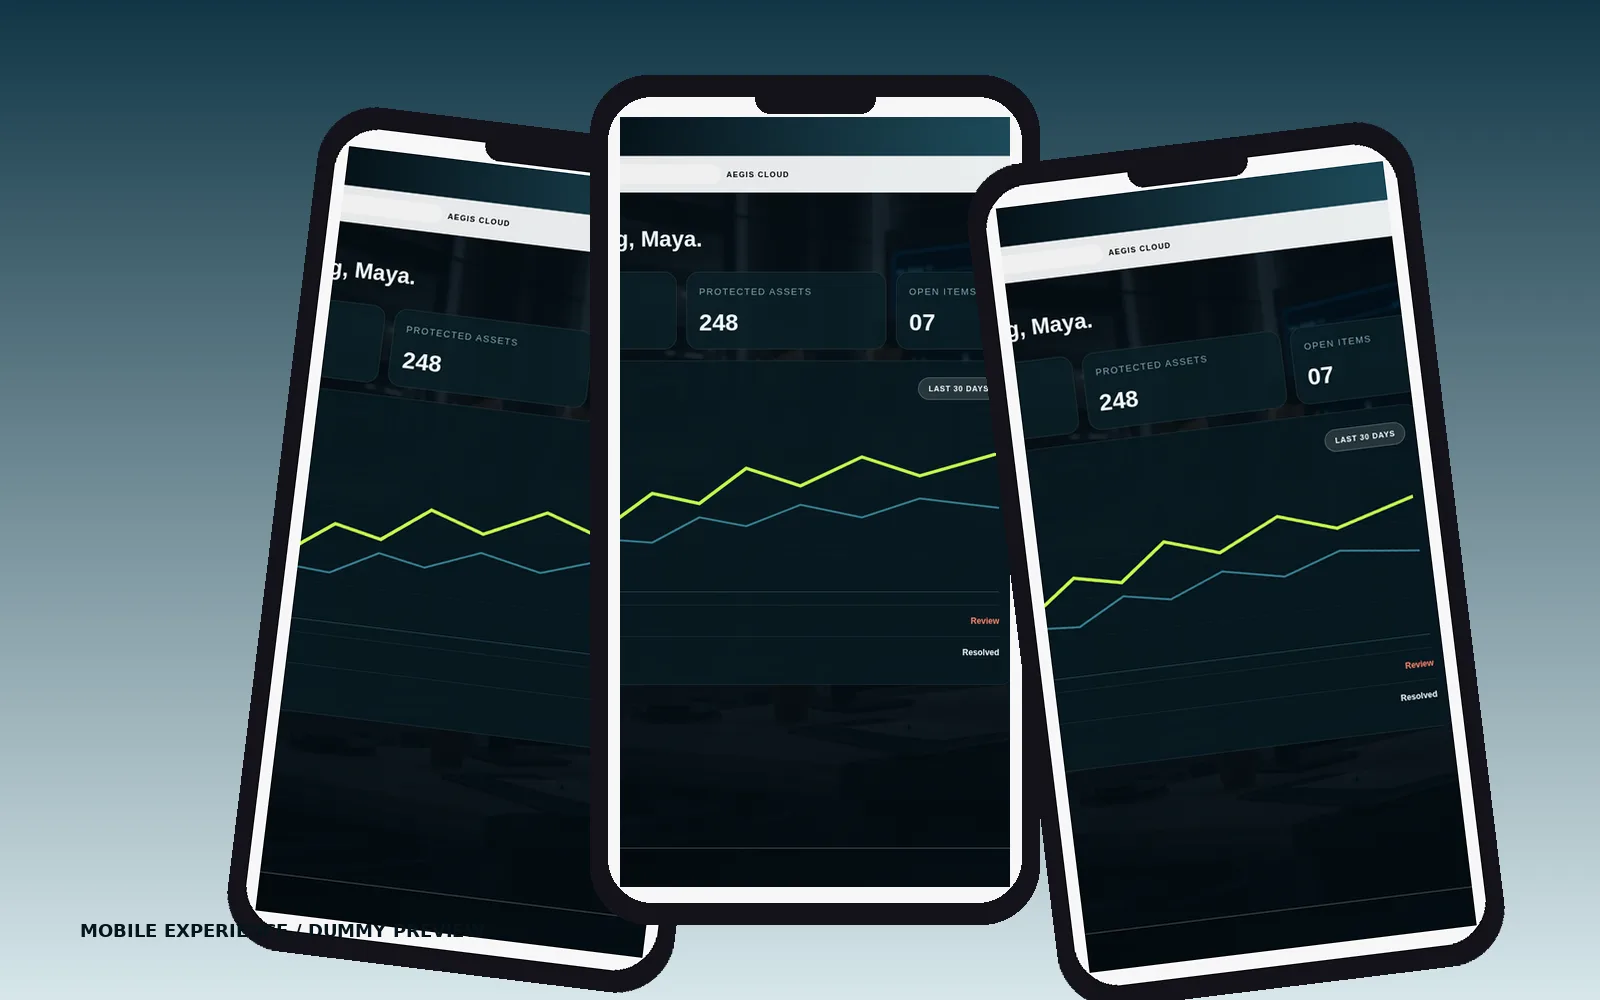
The product supports the complete path from a detected signal to a tracked and accountable response.
HOW PSCS APPROACHED ITRisk first.
Risk first.
Interfaces second.
The design sequence started with risk decisions, operating ownership and response requirements before interface design began.
Assets, threats, controls and stakeholder reporting needs.
Risk categories, severity rules, ownership and status logic.
Dashboards, incident views and action priorities.
Cloud architecture, data flows, access control and integrations.
Scenario testing, operational review and controlled rollout.
From risk signals
to response action.
SELECTED INTERFACES / 02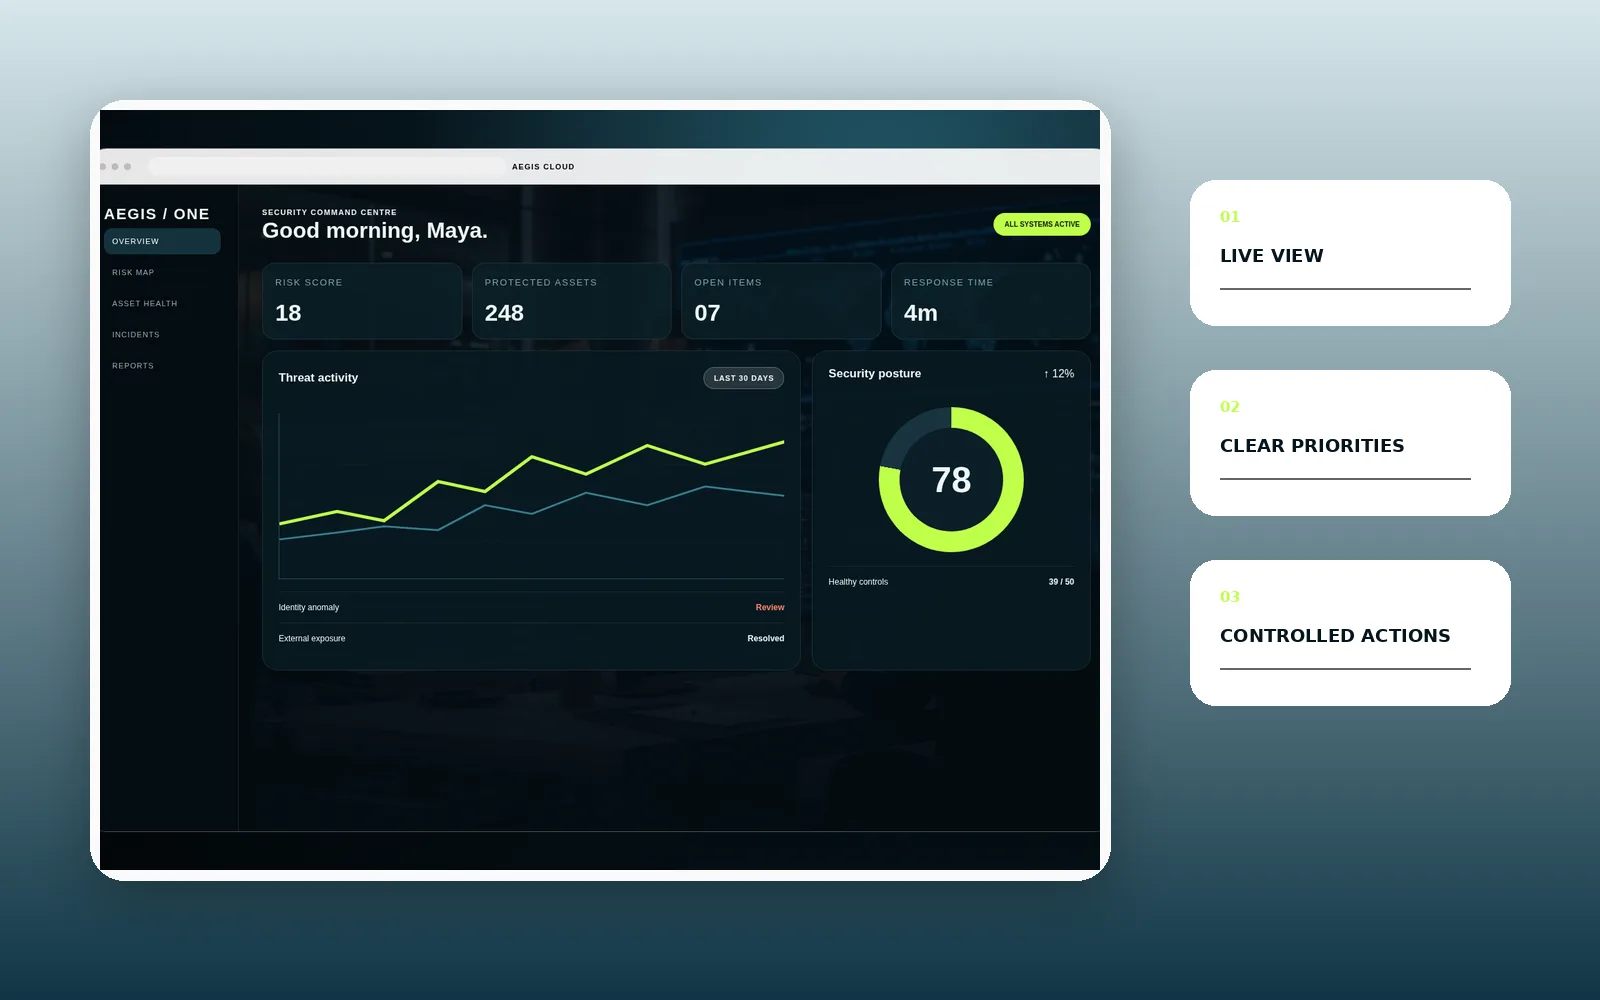
Business impact.
These figures are dummy values for the design preview. Final case studies will use verified and client-approved results only.
38%FASTER TRIAGEReduced time required to understand and assign security events.
1RISK VIEWAssets, incidents and controls visible through one platform.
27%FEWER OPEN ITEMSImproved ownership and follow-through across response actions.
24/7OPERATING VISIBILITYA continuously available command view for security teams.
SAMPLE METRICS FOR LAYOUT PREVIEW. FINAL CASE STUDIES WILL USE CLIENT-APPROVED DATA ONLY.
“The value was not another security dashboard. It was a clearer way for the team to decide what mattered next.”
RAHUL VERMA / CISO, AEGIS ONEDUMMY TESTIMONIAL FOR DESIGN PREVIEW
Technology and integrations.
CLOUD SECURITYIDENTITYSIEM INTEGRATIONRISK ENGINEROLE ACCESSAUDIT LOGGING

Let’s build the right solution.
Tell us what is slowing the business down, creating risk or limiting growth. We will help define the practical next step.
Discuss your project